top of page

Since discovering a sizable oil discovery in offshore Guyana, Exxon Mobil, along with several exploration and production partners, actively explored the subsea field and is now producing thousands of barrels of oil per day from several FPSO platforms. Font: https://oilmanmagazine.com/auv-technology-pushing-offshore-guyana-ep-discovery-forward/

Exxon Mobil contracted with Ocean Infinity to conduct high-resolution geophysical and geotechnical data capturing using an autonomous underwater vehicle (AUV) over 3,100 square miles and in water depths of up to 7,000 feet. Using AUVs allowed the company to gather data quickly without significant environmental impacts, unlike conventional survey methods.

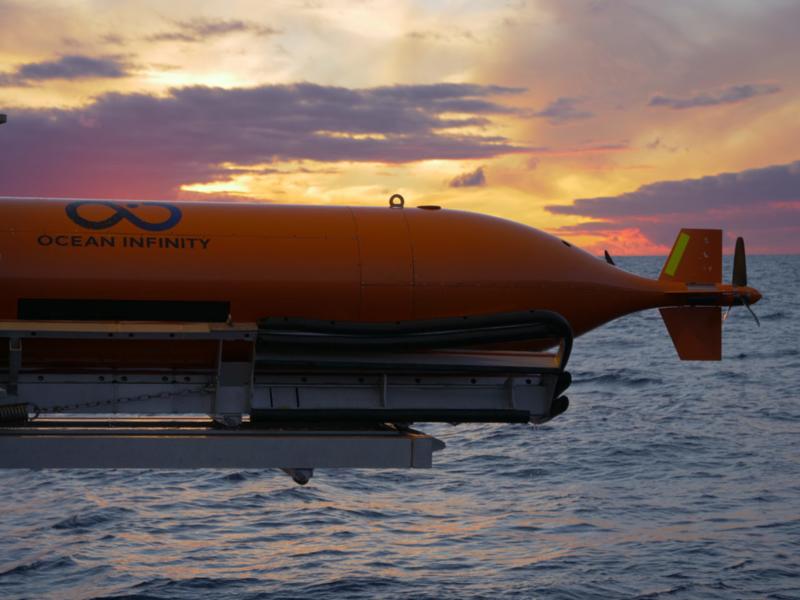
“The successful completion of this project for ExxonMobil in Guyana is further evidence of our ability to sustainably deliver the highest quality results to our clients using our cutting-edge robots. We are constantly striving to push technological boundaries so that we can rapidly deliver high-quality results and the upcoming deployment of our Armada fleet in January 2021 is further testament to this,” said Josh Broussard, CTO, Ocean Infinity.

Exxon Mobil initiated oil and gas exploration off the Guyana coast in 2008. Liza Phase 1 was the first producing platform to come online in 2015 comprising 295 feet of oil-bearing sandstone reservoirs. The company has discovered 16 oil and gas fields in the Stabroek block since Liza and is expected to produce more than eight billion barrels of oil. In the May/June issue of OILMAN, our publisher, Emmanuel Sullivan, reported on the Exxon Mobil discovery in offshore Guyana, read more here.

The global oil & gas analytics market was valued at US$ 13 billion in 2019 and is anticipated to expand at a CAGR of ~15 percent during the forecast period. Font: https://oilmanmagazine.com/oil-gas-analytics-market-to-reach-valuation-of-49-billion-by-2030/


The global oil & gas analytics market was valued at US$ 13 billion in 2019 and is anticipated to expand at a CAGR of ~15 percent during the forecast period. Based on service, the professional segment held a prominent share of the global oil & gas analytics market in 2019, as professional service provides the choice of personalized advisory services for solutions by using case definition, planning, and build activities through analytics expertise and methodology and tools. In terms of deployment, the hosted segment accounted for a major share of the global oil & gas analytics market in 2019. Based on application, the upstream segment constituted a significant share of the global oil & gas analytics market in 2019. The demand for upstream services is high among oil & gas companies.

New Discoveries in Oil & Gas and Other Fuels, and Shale Gas Boom to Boost Oil & Gas Analytics Market

  • New discoveries in oil & gas and other fuels are taking place across the globe due to the rise in prices of fuel. This is one of the major drivers of the global oil & gas analytics market. Most of the companies are deploying oil & gas analytics to boost their production and increase operational efficiency.

  • Investment in oil & gas exploration across the globe rose by 20 percent and about 140 discoveries were made in the year. The total estimate for discovered resources stood at around 9 billion barrels of oil equivalent in 2018. It was 10 billion barrels of oil equivalent in 2017. Offshore discoveries were prominent with 60 percent share, while gas resources accounted for about 40 percent share in 2018.

  • The shale gas boom, which led to significant production of oil and natural gas in the U.S., is boosting the oil & gas analytics market

North America Leads Oil & Gas Analytics Market

  • North America was the key region of the global oil & gas analytics market in 2019. The U.S. dominated the oil & gas analytics market in North America in 2019. An increase in oil and gas exploration and production activities in North America is expected to boost the demand for oil & gas analytics in the region. It is also anticipated to be a highly attractive region of the global oil & gas analytics market in the near future.

  • Investment in exploration and production of shale gas has been rising in the U.S. in order to meet the increasing demand for crude oil across the country. Oil & gas analytics is used to analyze drilling data to identify new subsurface oil fields. Hence, the U.S. is anticipated to lead the oil & gas analytics market in North America in the near future.

  • In terms of market share, Europe follows North America in the global oil & gas analytics market. This can be primarily ascribed to the rise in investment in the upstream sector in countries such as Russia, Norway, the U.K., and CIS countries in the region. These countries are major producers of oil & gas in Europe and utilize oil & gas analytics to obtain real-time well operation data. Hence, the oil & gas analytics market in Europe is likely to expand during the forecast period.

  • The oil & gas analytics market in Asia Pacific and Middle East & Africa is projected to expand at a high CAGR in the near future. The rise in investment in the oil & gas industry, along with governments’ initiative to promote automation in the oil & gas industry, is estimated to drive the oil & gas analytics market in these regions in the near future.

Major Developments in Oil & Gas Analytics Market

  • In April 2020, Hitachi, Ltd. announced that it had signed an agreement with Fusionex International Plc (Fusionex), a Big Data and AI technology market leader in Asia, to acquire the successor company of digital business under the “Fusionex” brand, as a wholly-owned subsidiary. Hitachi aims to be a global leader of social innovation business in the 2021 mid-term management plan. It plans to invest aggressively in the IT sector with a focus on North America and Asia.

  • In July 2020, The John Lewis Partnership announced that Capgemini, a leading global consulting, technology services and digital transformation company, had been selected to provide specialist IT application services to support the Partnership’s technology systems and business processes. Capgemini will support the Partnership’s core operational IT application services used across the technology estate to run businesses such as trading, supply chain, finance and personnel systems, and core enabling services such as integration and information.

Competition Landscape of Oil & Gas Analytics Market

  • The oil & gas analytics market is dominated by multinational players operating across the globe. Prominent players operating in the global oil & gas analytics are IBM Analytics, Accenture, Oracle Corporation, SAP SE, Microsoft Corporation, Hewlett Packard Enterprise Development LP, Northwest Analytics, Inc., and TABLEAU SOFTWARE, LLC

The common vulnerability scoring system (CVSS) provides manufacturers a way to assess the principal characteristics of a vulnerability and produce a numerical score reflecting its severity.

This can then be translated into a qualitative representation, such as low, medium, high or critical, to help organizations in their vulnerability management processes. Here, Claudia Jarrett, country manager at industrial parts supplier EU Automation, explains the core concepts of the CVSS.


When fully protected, technological devices, both on and offline, can optimize a number of processes on the factory floor. However, advances in technology are allowing manufacturers to streamline and monitor processes by connecting devices to monitor production in real-time.


Take a programmable logic controller (PLC) as an example. It is an automated decision-making tool that monitors the state of connected devices and makes decisions to streamline processes. As technology has advanced, PLCs have begun offering remote access for ease of maintenance and more flexibility to control other devices.


To monitor and control processes, PLCs must be connected to the internet. However, this exposes the technology to cyber-attacks. When installing these devices, manufacturers must choose the correct supplier that prioritizes security in both the device and its programming tools. 


As the number of devices connected to the internet increases, so does the number of vulnerabilities. The CVSS allows manufacturers to categorize these potential vulnerabilities to ensure that the most dangerous are patched before an attack occurs. 

What’s the score?

The CVSS was developed by the National Infrastructure Advisory Council (NIAC) and consists of three metric groups; base, temporal and environmental. The base score severity range is a metric, measured zero to ten, which represents the characteristics of the vulnerability. This part of the score takes into account the impact of the vulnerability if it was exploited. It also considers the exploitability — how the vulnerability is accessed, the complexity of the required attack and the number of times an attacker must authenticate to be successful. 


The temporal score represents the characteristics of the vulnerability that are not fixed. Again, this covers the exploitability, but also the techniques or code that change over time. It also takes into account the level of remediation that is available for the vulnerability and the level of confidence in the existence of the vulnerability. 


Finally, the environmental score is all about the user’s environment, including the collateral damage potential of the vulnerability. In other words, this is about the impact on other equipment, people and businesses if the vulnerability is uncovered.


It’s virtually impossible for companies, especially those that are small to medium sized, to patch every vulnerability as soon as it is found. The CVSS gives an intuitive way of understanding which attacks will have the biggest impact, meaning that you can continue implementing digital technologies that will improve your workflow, without having to worry about breaches. 

Ativo 1.png
bottom of page